
Fast Track App

Solutions Proposed
To address these issues, our team recommended a set of scalable, data-driven solutions:
Upgrade Payment Processing – automate transactions, ensure accuracy, and improve financial reporting
Leverage Data Analytics – use performance monitoring, route optimization, and post-trip surveys to drive service improvements.
Ensure Flexibility and Scalability – design adaptable systems that support expansion into new markets.
Customize Ride Options – allow riders to personalize their trips and give drivers greater control over preferences.
Investigate Vehicle Types – identify underperforming vehicles using survey and trip data to align cars with ride types.
Offer Targeted Discounts – use promotions during peak seasons or longer trips to encourage loyalty.
Strengthen Data Security – adopt encryption, audits, and access controls to protect sensitive information.
Enhance Driver Training – provide education on new features, tools, and best practices to improve consistency.
Questions Addressed
To translate FastTrack Rides’ business challenges into measurable insights, we focused on three core areas: driver performance, payment accuracy, and vehicle characteristics. Each area was broken down into sub-questions that could be answered with SQL queries, ensuring the analysis stayed practical and directly tied to the company’s operational needs.
A) How does a driver's rating influence their performance and efficiency?
Which driver has the highest Rating-to-Rides Completed ratio?
What is the average rating for drivers with the fastest ride time?
What state are the highest rated drivers from on average?
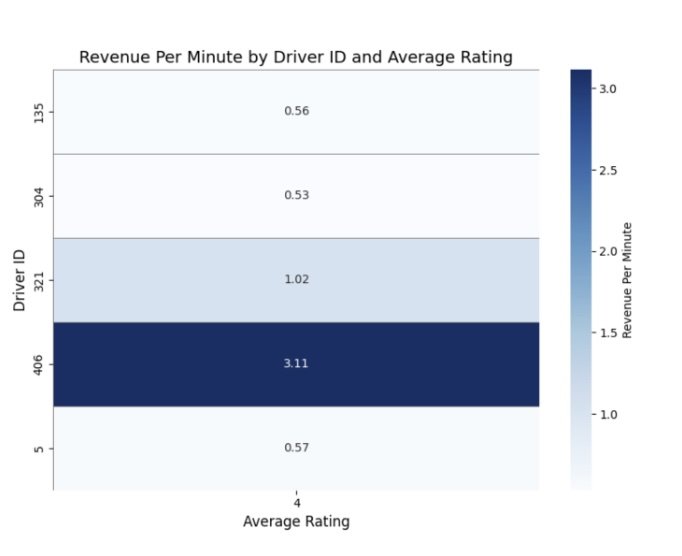
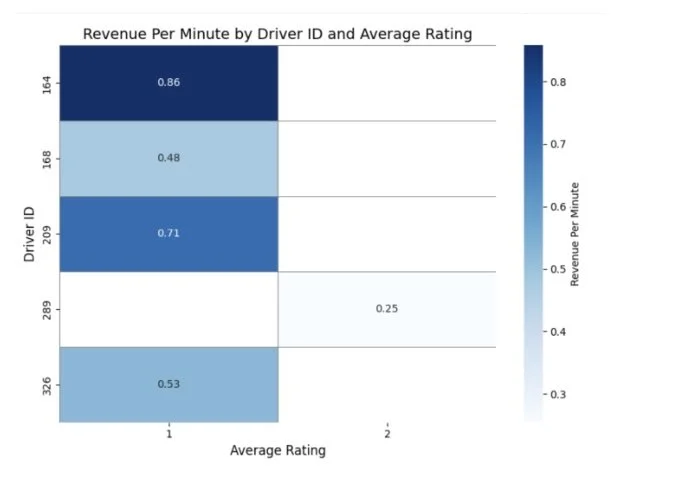
Figure 1 .Relationship between driver rating and revenue efficiency.
B) How will the payment system be accurate?
What is the difference between the amount the customer paid and how much they should have paid?
What weekday in 2024 brings in the most revenue?
On average, how does the fare per minute vary across different vehicle makes?
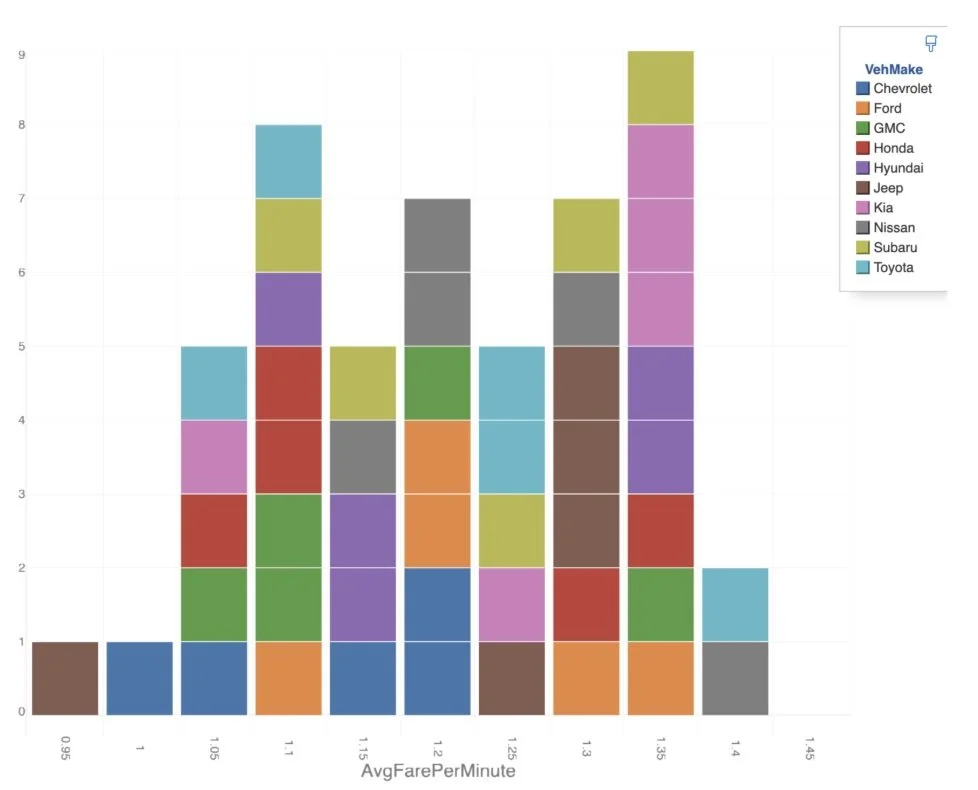
Frigure 2. Fare per minute compared across vehicle makes.
C) How do vehicle characteristics influence the quality of the ride experience?
Which vehicle types have the highest customer satisfaction ratings?
Which vehicle makes generate the highest revenue?
Does the color of a vehicle impact its popularity or customer preference?
FastTrack Rides: Systems Modernization and Analytics Plan
As part of my Database Design & Analysis class, I worked with a mock dataset from a ride-sharing company called Fast Track. FastTrack Rides was struggling with outdated systems and manual processes that made it difficult to scale operations. Inefficiencies in ride matching, payment processing, and driver–rider management led to delays, payment errors, and inconsistent service quality. Limited access to real-time data also restricted the company’s ability to optimize routes, adopt dynamic pricing, or respond quickly to operational challenges.

Figure 3. Average Customer Satisfaction by Vehicle Type
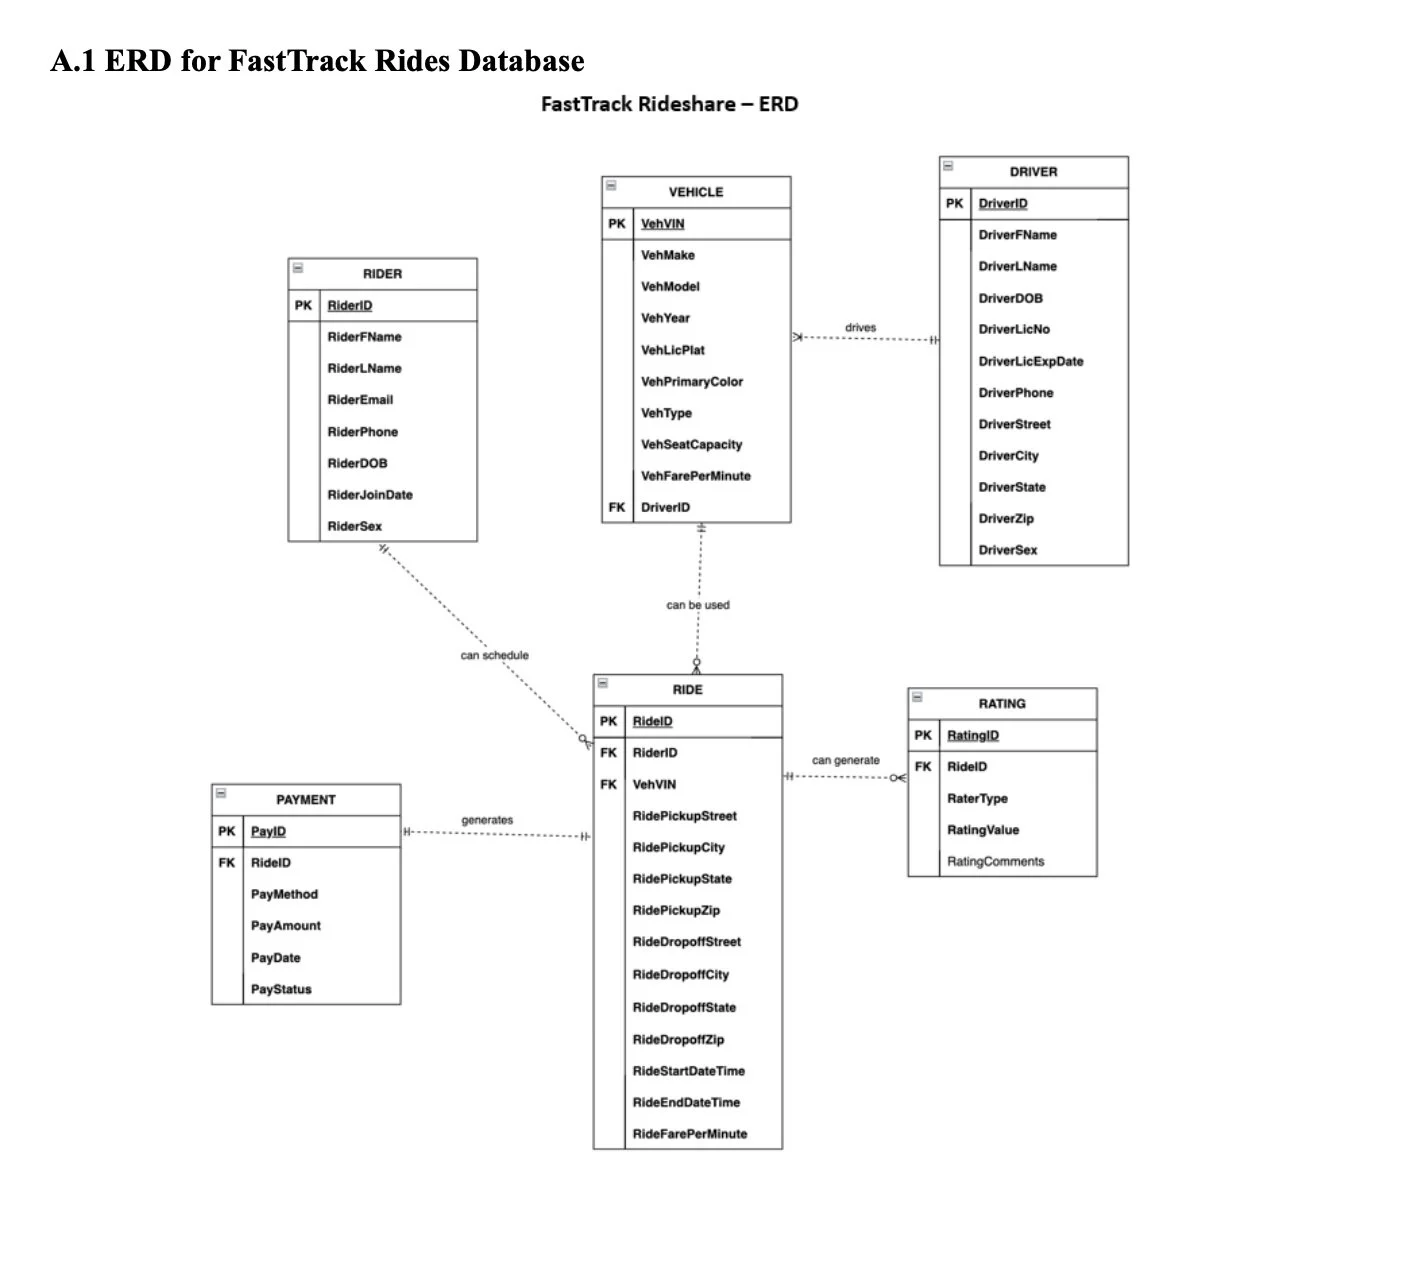
Entity Relationship Diagram (ERD)
To support the analysis, our team designed an ERD that organizes the relationships between drivers, vehicles, rides, payments, and ratings. This schema provided the structure needed to write SQL queries that connect operational data across multiple tables.
Technical Implementation (SQL)
This project was implemented using SQL to analyze FastTrack Rides’ operational data. Each research question was answered with a dedicated query that extracted insights from the ride, driver, and payment tables. Below are selected SQL queries that demonstrate the technical process. Full code for all questions is available in the attached project PDF.
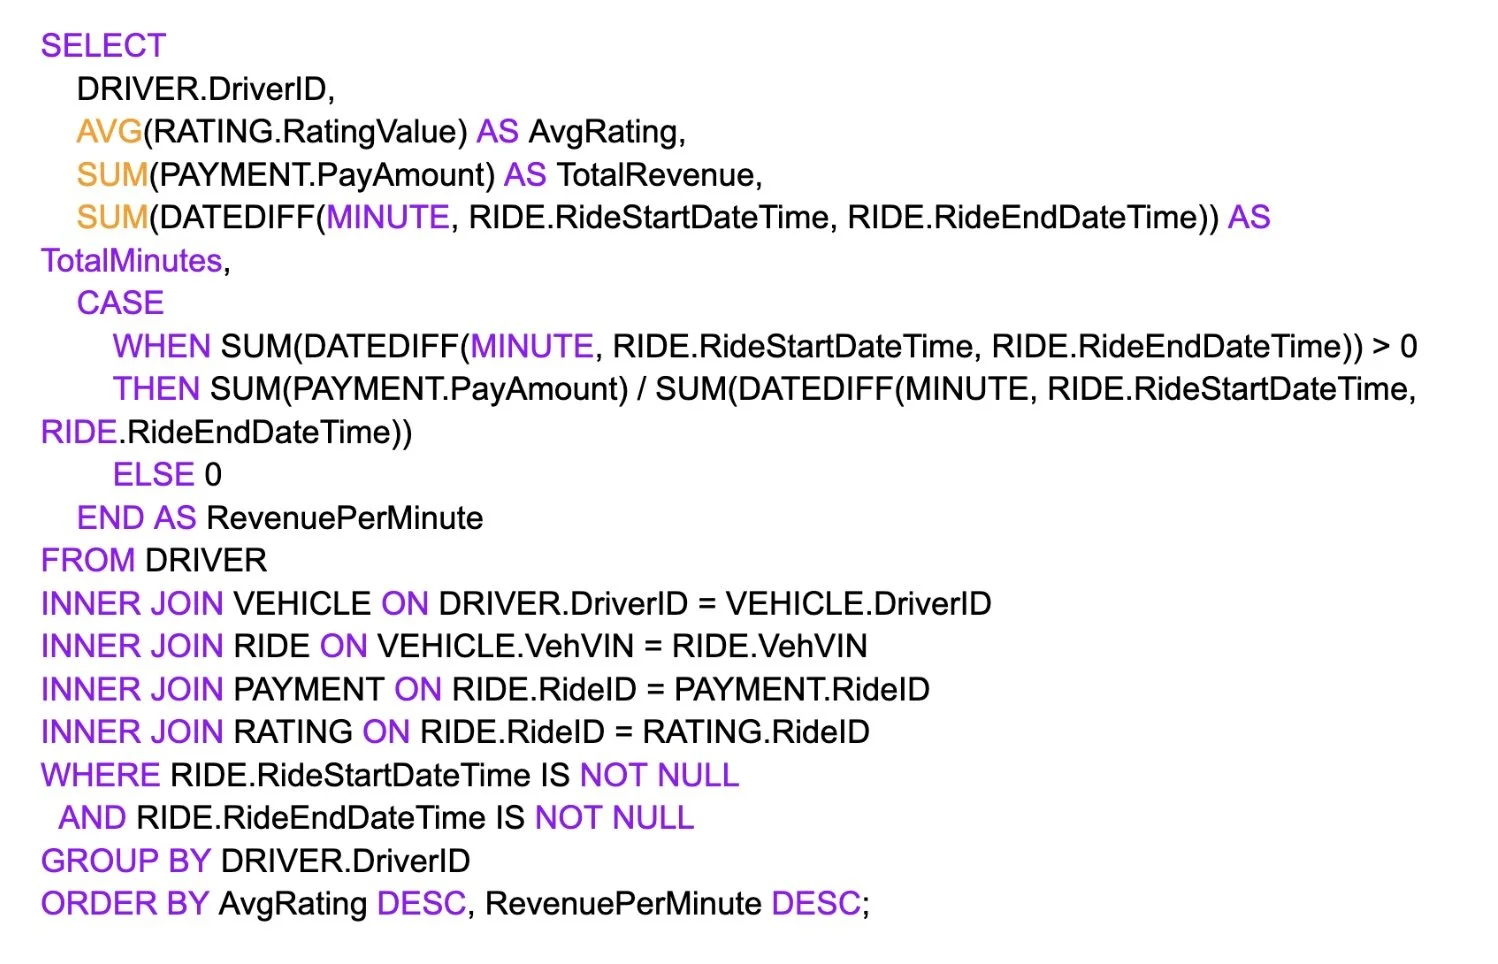
A. (1) Do higher-rated drivers generate more revenue per minute compared to lower-rated drivers?
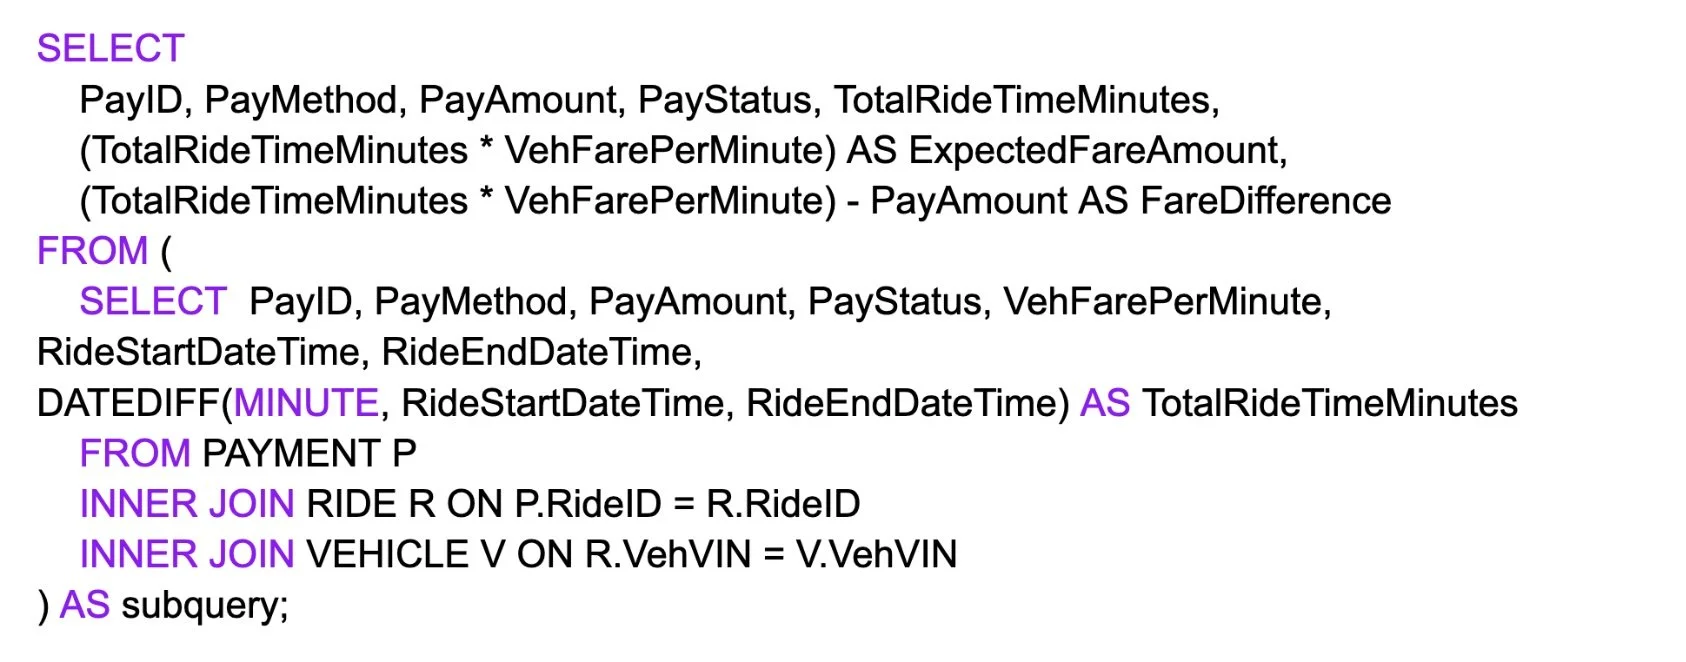
B. (1) What is the difference between the amount the customer paid and how much they should have paid?
Outcomes and Takeaways
This project strengthened my ability to analyze operational inefficiencies and design SQL-based solutions that connect directly to business needs. I gained experience in writing complex queries, building an ERD, and turning raw data into visual insights that inform decision-making. It also improved my skills in presenting findings clearly through structured reports and visualizations
Reflection
As this was a database class focused on SQL, the primary goal was to design queries and structure data effectively. At the time, my team and I built visualizations with Azure and Python, but they were inconsistent and not as clear as they could have been. This project made me realize that strong SQL and well-structured databases are the foundation, but pairing them with effective visualization is what truly brings the analysis to life. Since then, I have been building my skills in tools like Power BI and data visualization to present insights more clearly and professionally.
Skills Gained
SQL database design & query writing
ERD modeling for real-world business data
Data visualization for insights & storytelling
Business analysis & recommendations